


Original CDD Report
Cambridge Citizens Coalition's Review (Internet Archive Version)
The Bicycling in Cambridge 2023 Data Report is out. We are disheartened to say that it shows positive trends in bicycle use in the city. Fortunately, the Cambridge Citizens Coalition has already put a negative spin on it, so we’re going to follow their lead.
Just like the other CCC, we’re concerned about the type of data collection and analysis done by the city, as it isn’t good enough to get the exact number of cyclists and their locations in the city with GPS precision. There is a digital counter in Kendall Square that counts every cyclist every day, but Portland, Oregon has 70. Portland also has 2,062 miles of street compared to our 125 miles, but who’s counting. What our city does do is regularly conduct bicycle counts at 16 locations throughout the city at traditional commuting times. Statistical science has shown that larger pictures can be inferred from partial information, but we don’t like science.
People who like positive news will point out that cycling is up 23% since 2018, resident car ownership has been decreasing for decades, and bicycle crash rates and serious injuries are down. Fewer people are riding on the sidewalks as well.
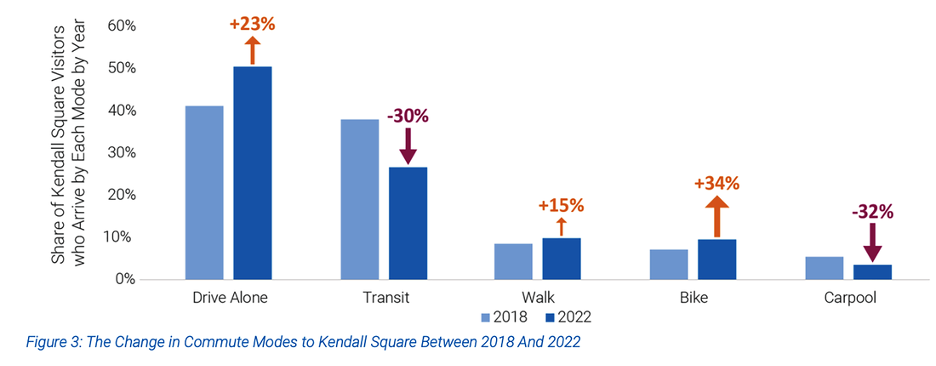
Ok, now back to the good part. We agree with the Citizens Coalition that it is in fact, “unfortunate news for the city,” that the number of people driving by themselves increased 23% and that carpooling is down 32%. Leaving out that those are percentages of total car trips and that the total number of trips has actually gone down since 2019 is a brilliant spin on the CCC’s part. They also pointed out that cycling was down 5% from 2019 to 2022, so we’re going to point that out too. The pandemic did decrease use of all forms of transit. It’s really not useful for our narrative though, so also that’s “unfortunate news” for us.

Stated another way, the number of miles of bike lanes DOUBLED in the same time period that cycling DECREASED by 5% from 2019 to 2022. That’s a NEGATIVE correlation. I used ALL CAPS so that you’d know that’s the important part. Entirely unrelated, shark attacks increase annually with ice cream sales, so you better stop eating ice cream.

We also take issue with the report’s cycling safety numbers. They’re using something called “crash rate” which compares the total miles biked to the number of crashes. This involves division though, which is math, which is just science in disguise, and as we said we don’t like science. We’d have to acknowledge that the crash rate is down 67% since 2003, as well as acknowledge that the incapacitating injuries decreased by 84% from 2004-2012 to 2015-2020. We would prefer to count the absolute number of crashes, but that’s not good for our narrative either because that number has been decreasing since 2012. Total crashes did drop significantly over Covid, but we’re going to assign that to there being fewer drivers without any evidence and accuse the city of not taking that into account. The Citizens Coalition didn’t give any, so why should we?
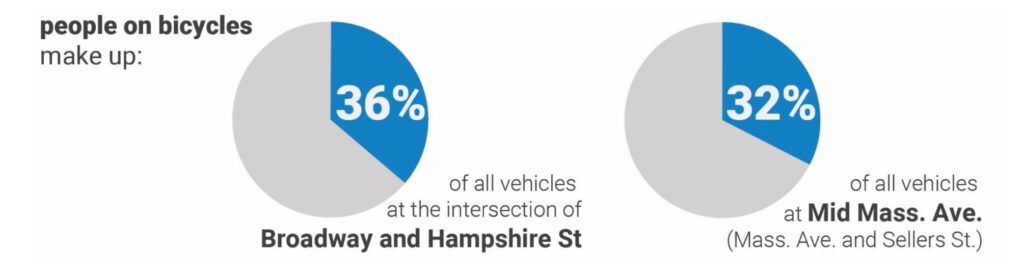
The city claims that from 2016 to 2022 riding on the sidewalk decreased on North and South Mass Ave by 68% and 82% respectively. Anything short of a year-by-year breakdown is meaningless, so we will disregard these numbers entirely. Same with the numbers showing that people on bicycles accounted for as much as 80% of all traffic turning from Hampshire Street to Broadway eastbound in the morning peak period.
The report never addresses the demographic inequities that may or may not be relevant. There are a lot of low-income families who we’re going to assume not only own cars but use them exclusively. Despite living in the middle of a city, they are car dependent and may as well have no other means of travel whatsoever. We as white homeowners feel that we can speak for the public housing residents on Broadway. We’re certain none of them work in Kendal or any location remotely walkable or bikeable like Central, Inman, Harvard, Porter, or Union squares. Heaven forbid they have to walk to Kendal to get on the Red Line or take the bus into Boston. The people left out of the conversation by the city and again by us, “are just trying to live.” Cheap parking is essential to life.
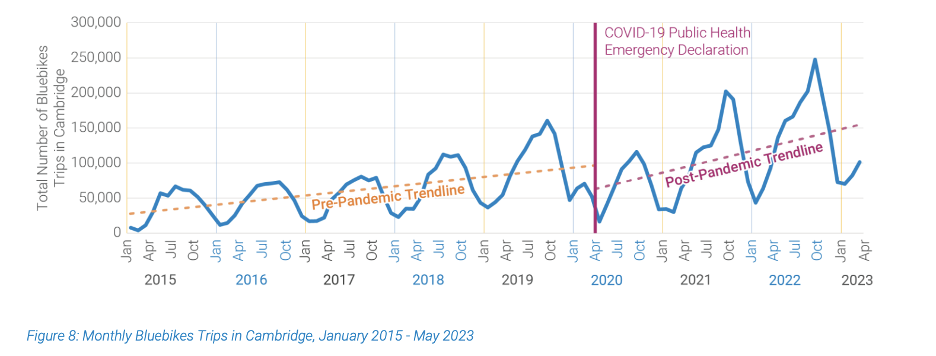
Bicycling reports often leave out the vast differences between Summer and Winter biking. The city’s report, however, has a whole bunch of charts showing the annual ebbs and flows. What, did you really think we’d do something as brazen as implying that the city’s report doesn’t show this while also using their graphs? Even that’s too much for this CCC. This graph of Bluebikes usage clearly shows drops in Winter ridership. It also shows that winter ridership last year was greater than summer ridership in 2015. How interesting. Hmm…
This wouldn’t be an anti-bike bike post without mentioning the local businesses, so “my guess” is that 15% to 25% of local business customers will literally evaporate if we remove any parking whatsoever. It’s what we said would happen in Inman Square after street construction and parking removal there. Still waiting. Any day now.
And finally, we believe that the increased bike and bus lanes are going to cause more car traffic which will drive people to use Uber and Lyft. We have no evidence for this what-so-ever, at least we’re not showing it here, but it sounds bad, which is good. Besides, it’s not like making the bus more reliable will get more people to use it. If anything, we should be adding travel lanes. Someone once tried to explain to us that adding lanes increases car traffic because of something called “induced demand”. We told that nerd to shut up.
All images available from the original CDD report.